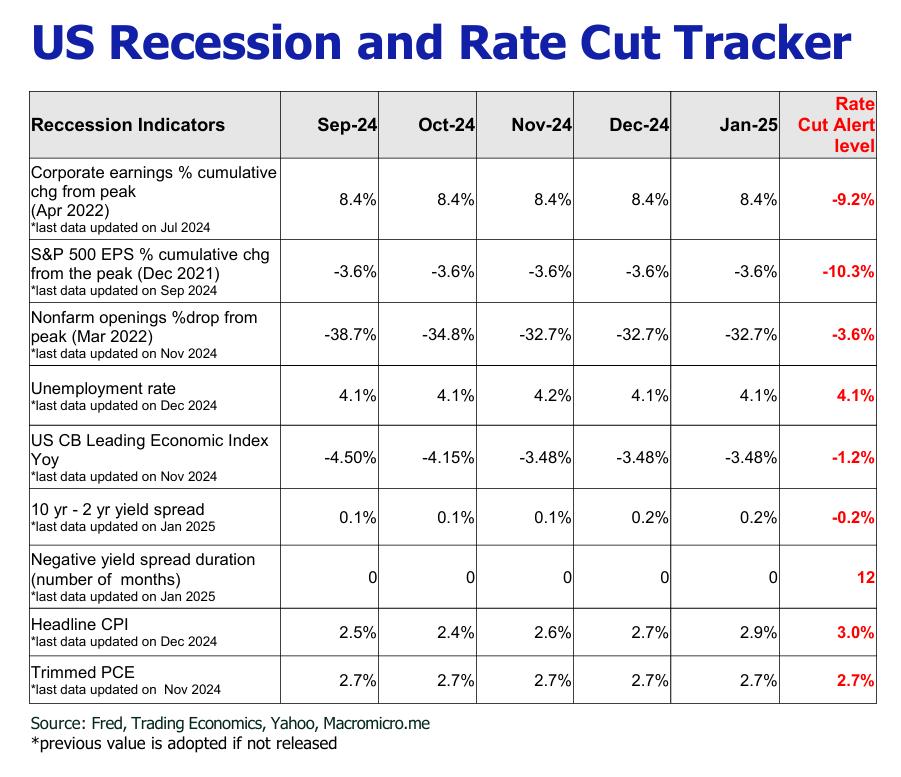
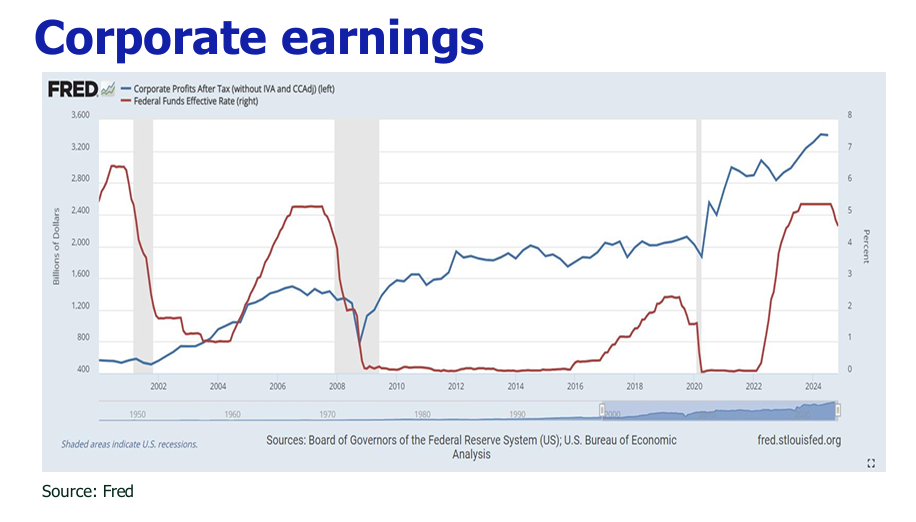
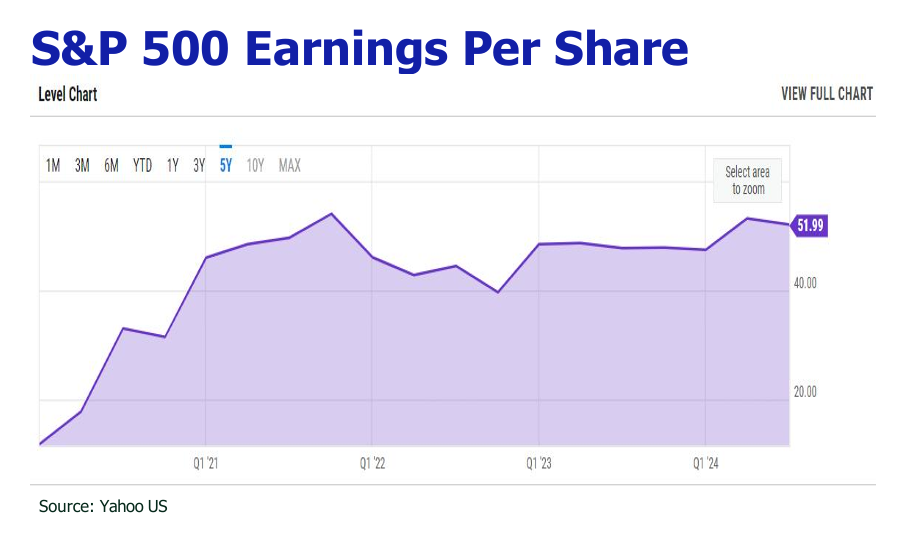
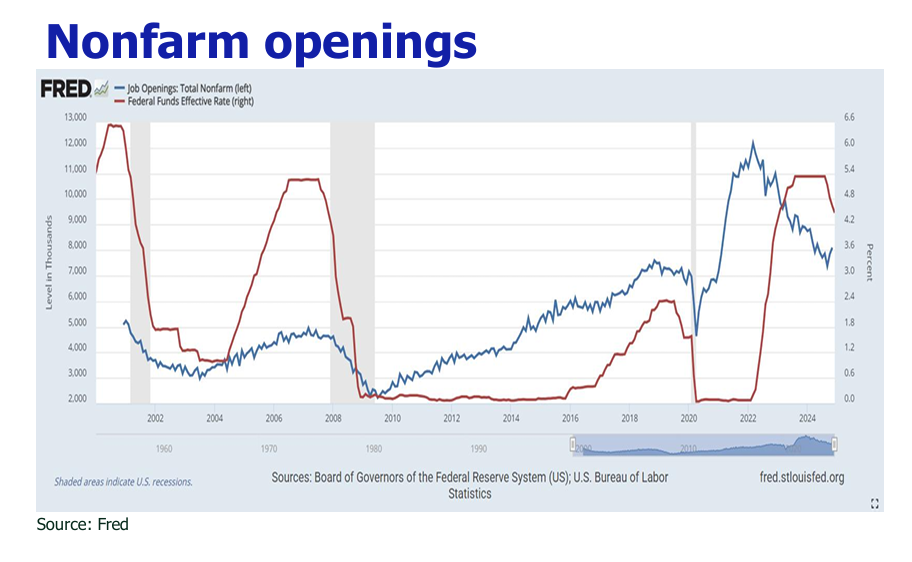
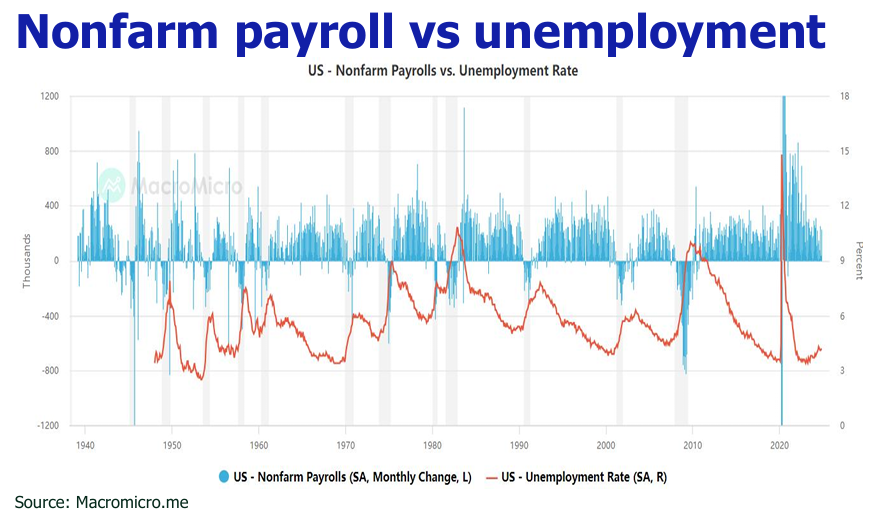
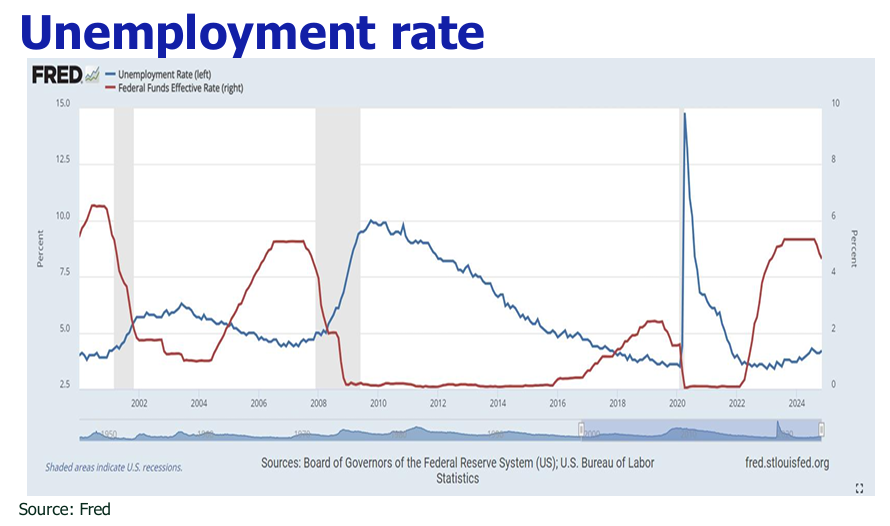
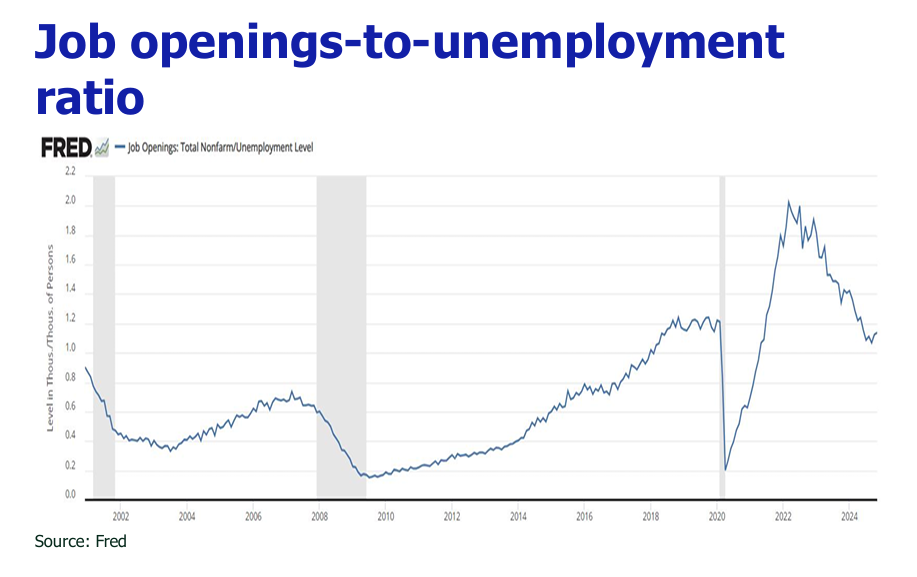
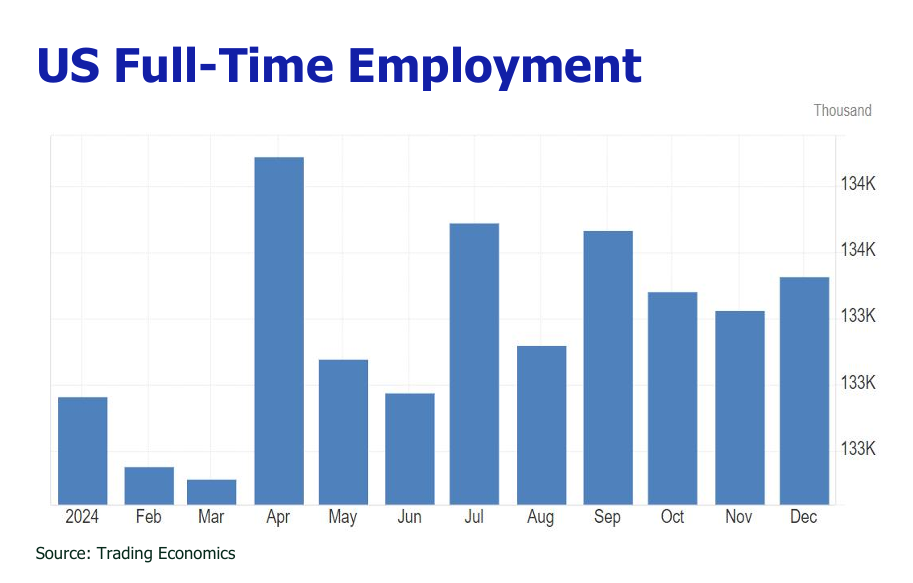
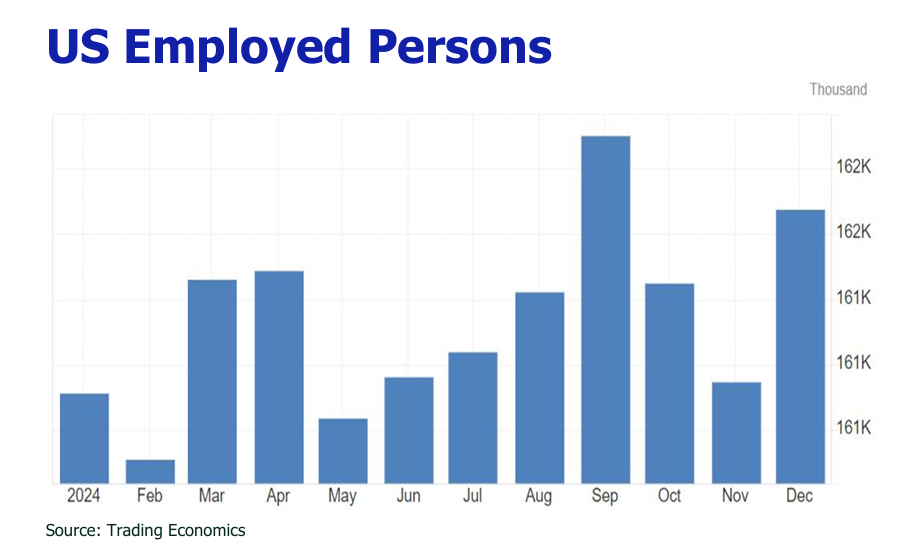
A bumpy bull year
Austin Or, CFA
Highlights
The scorching NFP hike and lowered unemployment rate diminished the pressing need for rate cuts.
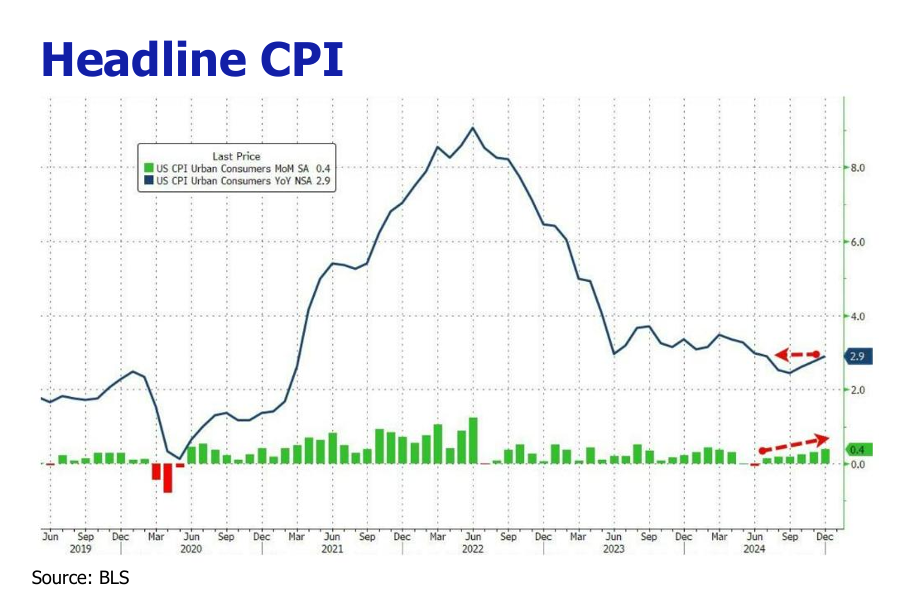
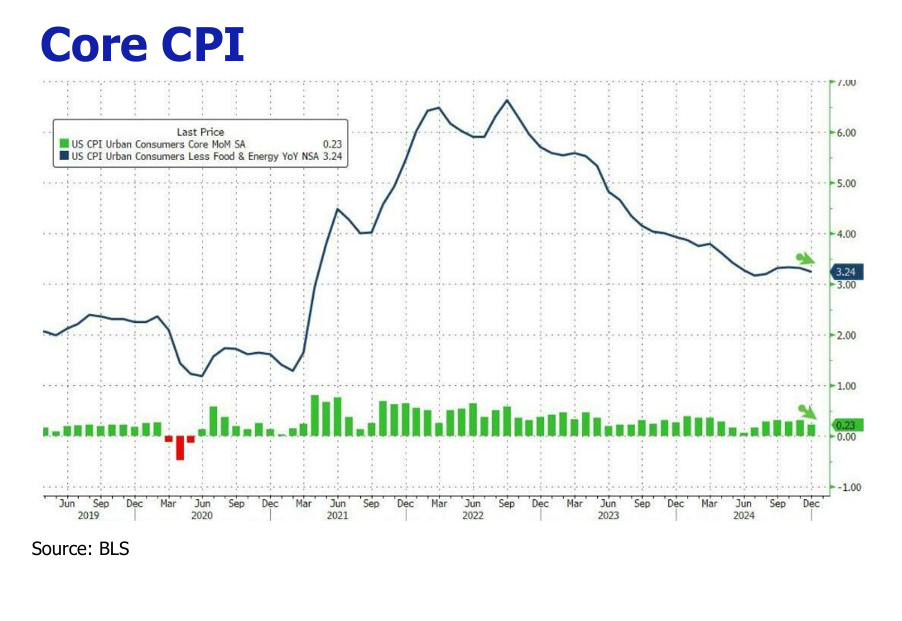
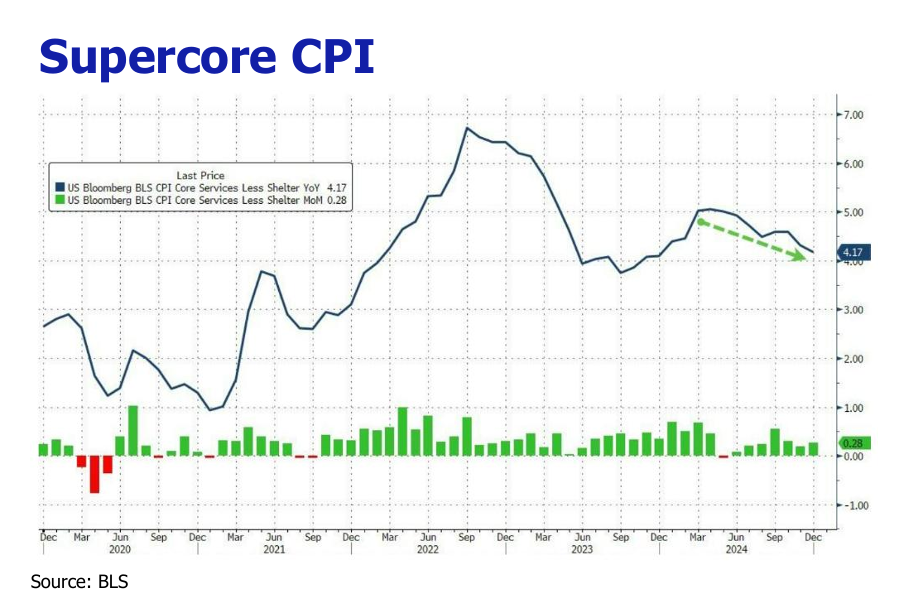
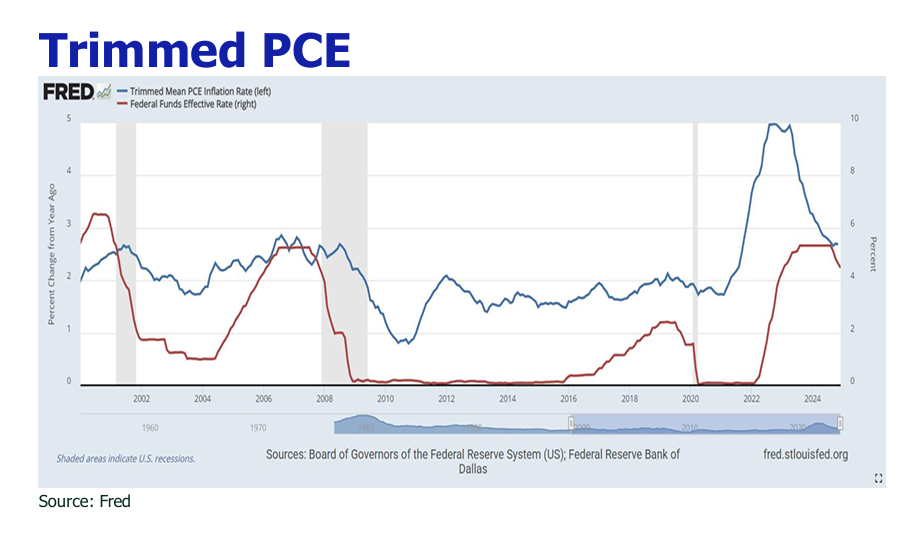
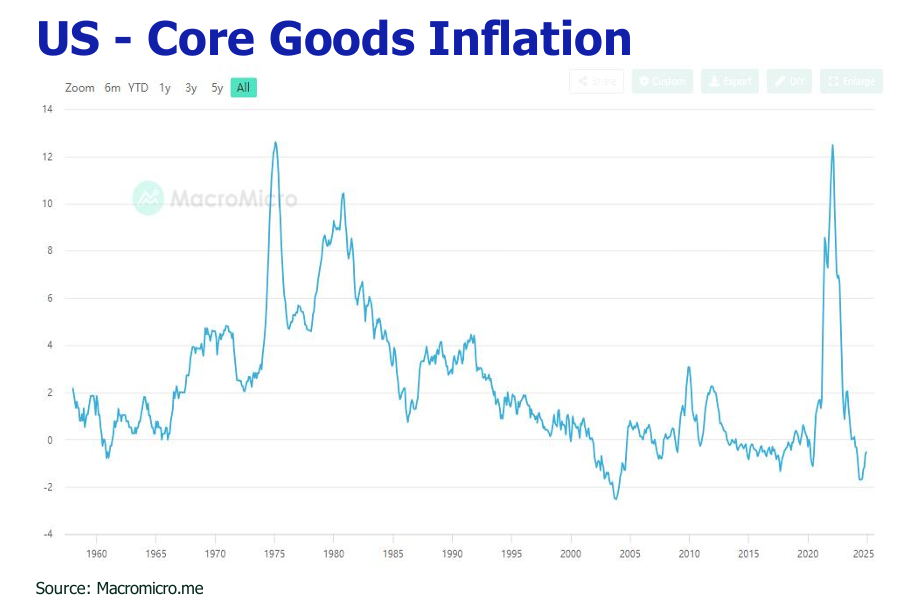
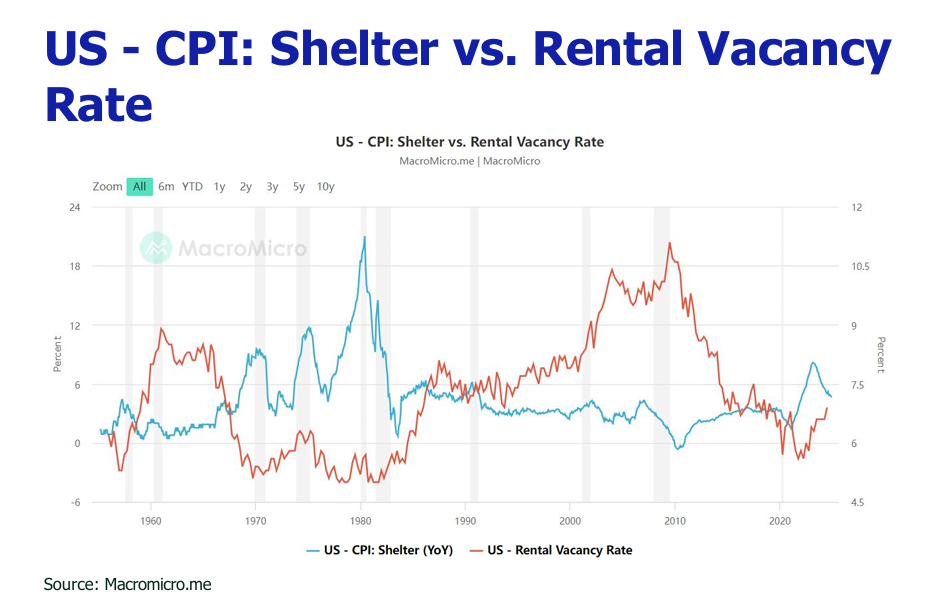
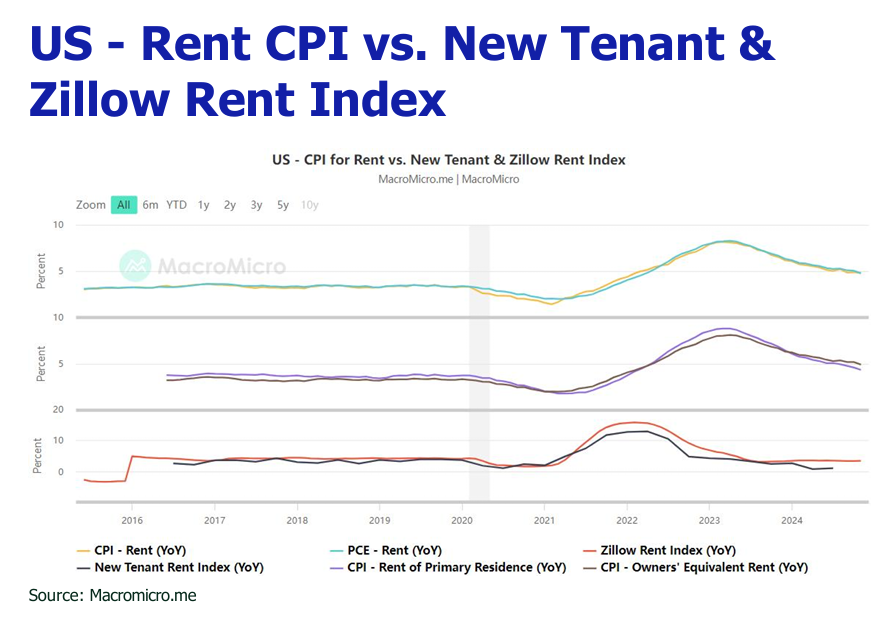
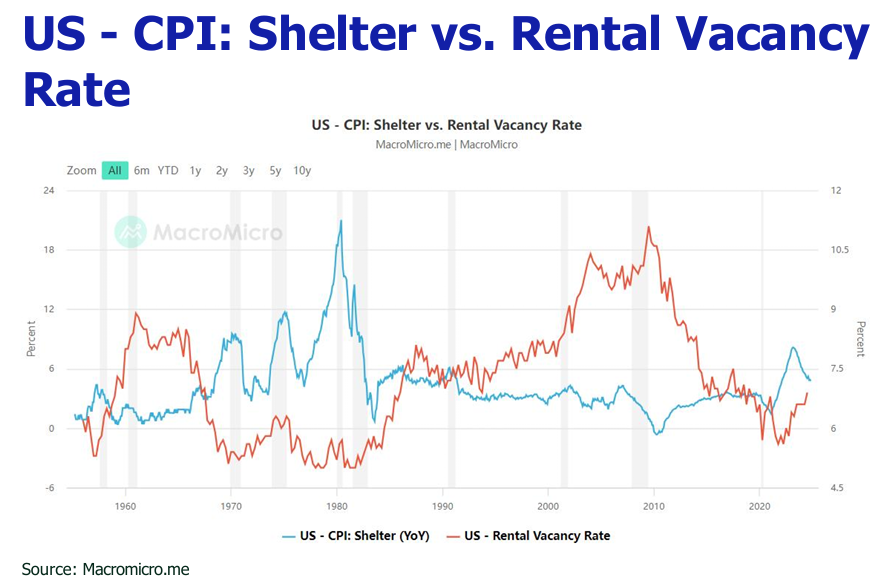
A moderation in core CPI has revitalized confidence in the disinflation narrative.
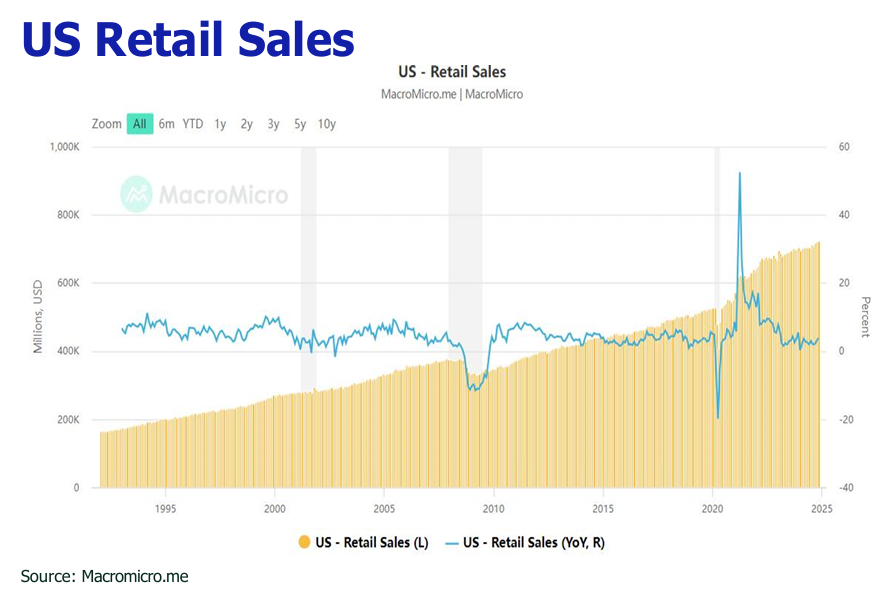
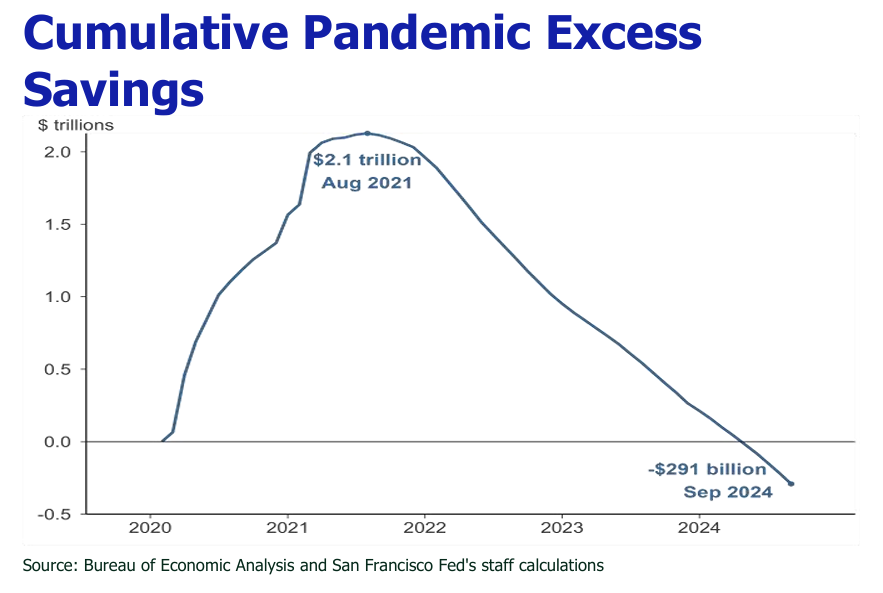
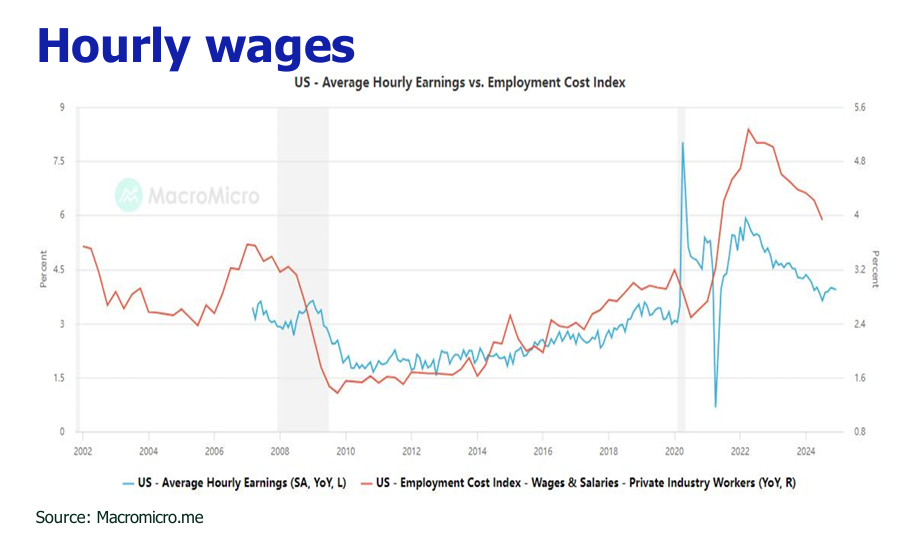
US December retail sales remain steadfast, bolstered by robust wage growth.
The forthcoming Trump 2.0 tax cut and tariff intensify the bifurcation between the service and the manufacturing sectors.
BTC is poised to hit US$150k before June, fueled by Trump’s pledge to build a BTC strategy reserve and the fiery accumulation of BTC and spot BTC ETF by listed companies and institutional investors.
We align with the consensus of a 50bp-75bp Fed rate cut in 2025, excluding curveballs from Trump’s 2.0 tariff and NFP hike.
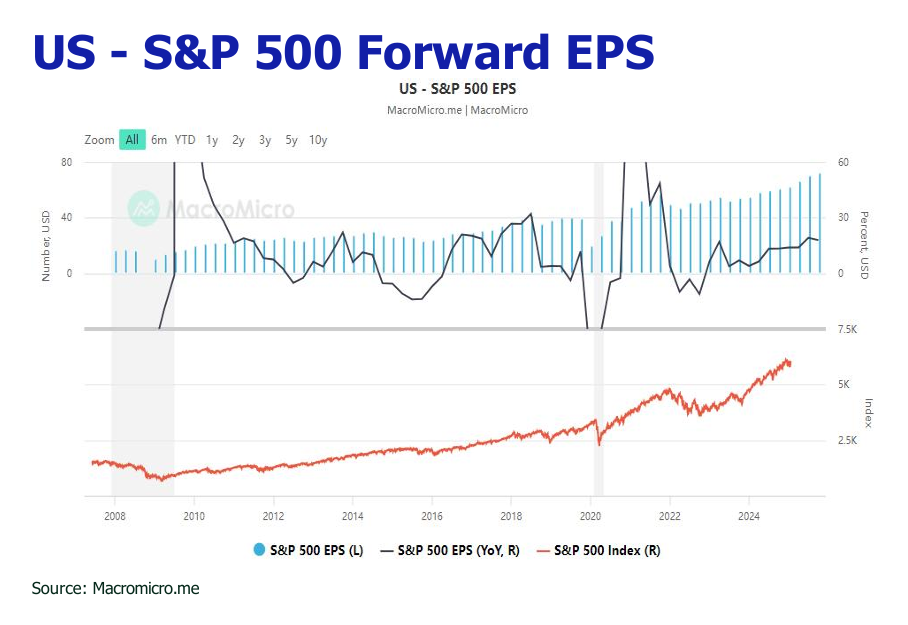
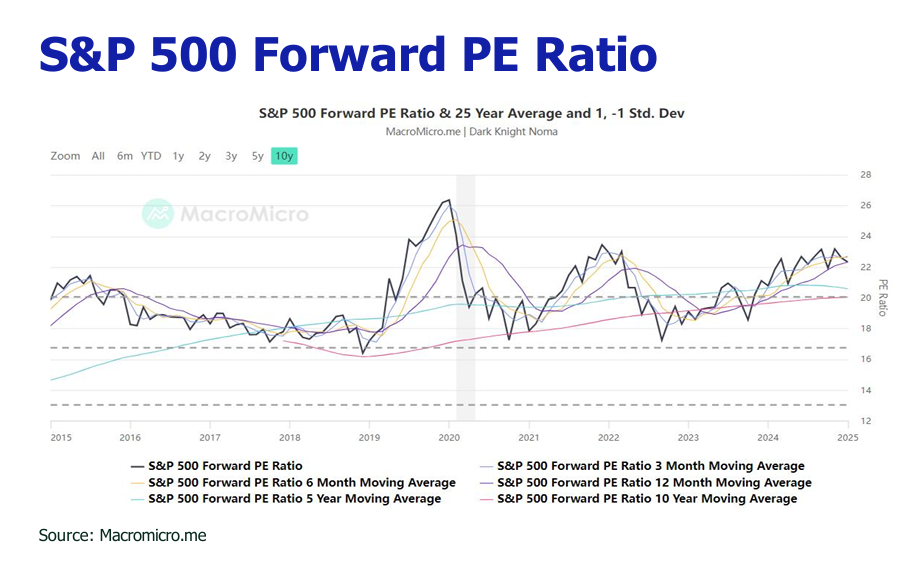
We have set our 2025 S&P 500 target at 6,600, consistent with the market’s anticipated range of 6,500 to 7,100 and envisage higher market volatility surrounding the rate cut path.
HK residential property prices are projected to experience a 5% downfall in 2025 due to the high outstanding primary flat inventory.
Depreciation of RMB to 7.6 USD/RMB and 1:1 HKD/RMB by 2025 in response to the Trump 2.0 tariff.
NFP sizzled to 256k with the umployment rate edged down to 4.1%
In the latest US employment report for December, non-farm payrolls soared by 256,000 positions, marking the most substantial surge in nine months and surpassing the adjusted November tally of 212,000. The unemployment rate for December stood at 4.1%, a commendable dip below November’s 4.2%. Job creation mainly concentrated in key sectors such as healthcare (with an increase of 46,000 roles), leisure and hospitality (adding 43,000 positions), and government roles (expanding by 33,000). The remarkable upsurge in NFP diminished the Federal Reserve’s impetus to reduce rates further to support the labor market, instilling unease regarding the greater likelihood of sustained elevated interest rates, and clouding stock valuations and the trajectory of earnings growth momentum with uncertainty.
Although the December figures appear promising, they may embellish the true vigor of the labor market. This surge was partly fueled by the recovery from the disruptive hurricanes in October, the seasonal uptick in healthcare employment during the flu season, and a notable rise in part-time employment (247,000) juxtaposed with full-time roles (87,000). Despite the robust December numbers, the average non-farm payroll figure for the quarter settled at 168,000, indicating a slowdown compared to the first (233,000) and second (271,000) quarters but showing resilience against the weaker third quarter (142,000).
Core inflation reprieved and kept disinflation odds alive
In December, the US Consumer Price Index (CPI) exhibited growths of 2.9% YoY (2.7% YoY in November) and 0.4% MoM (0.3% MoM in November). This acceleration was primarily propelled by changes in energy (-0.5% YoY, 2.6% MoM) and food prices (2.5% YoY, 0.3% MoM). Notably, the surge in energy costs contributed approximately 40% to the index’s MoM advancement.
Despite the uptick in headline inflation figures, the notable moderation in core CPI figures has reignited beliefs in a disinflationary trend. Core CPI showed growths of 3.2% YoY and 0.2% MoM, down from 3.3% YoY and 0.3% MoM in November. Housing costs, a significant component of the CPI, decreased to 4.6% YoY (4.7% YoY in November) and remained steady at a 0.3% MoM in line with November’s data. The latest speech of Trump to seek lower oil prices by Saudi Arabia and OPEC on the World Economic Forum will favor the disinflation trend.
Retail sales ended 2024 on a strong note
US December retail sales posted gains of 3.9%YoY and 0.4% MoM, while the core retail sales (excluding automobiles, gasoline, building materials, and food services) surged 4.1%YoY and 0.7% MoM. These figures resonated with the strong yet somewhat tempered growth in hourly wages, which rose by 3.9% YoY and 0.3% MoM.
Persistent tug-of-war between service and manufacturing sectors
The seasonally adjusted Markit U.S. Manufacturing PMI registered at 49.4 in December, a slight decline from November’s 49.7, marking six consecutive months of subdued performance. Production was curtailed at an accelerated pace in December, hindered by disappointing new order inflows and exacerbated by rising input costs stemming from impending Trump tariffs and a tempered rate cut. On the contrary, the seasonally adjusted Markit U.S. Service PMI ascended for the second consecutive month in December, achieving a remarkable 33-month high of 56.8, up from November’s 56.1. This brisk performance within the service sector has more than compensated for the ongoing economic drag exerted by manufacturing. Optimism surrounding favorable tax policies and protectionist measures through tariffs has invigorated the animal spirits, fostering expansion in employment, output, and new orders.
Prediction
1.BTCtohit US$150k before June.
The intention of Trump to establish Bitcoin (BTC) as a national asset reserve, coupled with the sustained accumulation of BTC by US-listed companies and investment institutions, is poised to prolong the bullish momentum of BTC. During the fourth quarter, BTC spot Exchange-Traded Funds (ETFs) attracted a substantial influx, amassing a total of $38 billion and elevating BTC’s market capitalization by $0.65 trillion. With an assumption of a comparable fund inflow rate in the first half of 2025, estimated at $76 billion, and a commensurate impact on capital inflow to market capitalization growth, BTC’s market cap is anticipated to surge by $1.3 trillion. This surge is projected to propel BTC’s market capitalization to $3.4 trillion, translating to a BTC price exceeding $150,000.
2. 50bp-75bp rate cut by the Fed in 2025.
CME futures pricing continues to suggest an overwhelming likelihood that the Federal Reserve will maintain its current stance during its upcoming meeting on January 28-29. However, there is a discernible shift towards two rate cuts occurring over the year. Despite the robust labor market report contrasting with the softer December Consumer Price Index (CPI) and wholesale indicators, key Federal Reserve officials have expressed the view that the labor market does not serve as the primary driver of inflation. They maintain that the trajectory for rate cuts remains intact, as inflation continues its course towards the 2% mark. Christopher Waller, a prominent official within the Federal Reserve, noted that the prospective number of rate cuts could range 3-4 times should disinflation advance at an accelerated pace. Conversely, if inflation persists stubbornly, this potential could diminish to one or two times. As per the Federal Reserve’s dot plot, the anticipated median fund rate for 2025 stands at 3.9%, suggesting two potential rate cuts, with the timeline possibly extending to the second half of the year, in light of stronger-than-expected labor market and the short-term inflation upheaval resulting from Trump’s tariff imposition.
While the NFP rally unfolds, it does not inherently signal an imminent uptick in inflation. Firstly, the substantial non-farm payroll figures may encompass part-time or low-wage positions, which contribute minimally to consumer spending or inflationary pressures. Secondly, wage growth appears to be moderating, indicating that inflation may not reignite. We align with the prevailing consensus that the Fed will stand pat during the January FOMC meeting and reiterate our belief that a rate reduction of 50 to 75 basis points is likely to occur in 2025. This strategic move aims to recalibrate the restrictive rate back to neutral level to foster full employment, stabilize inflation, and alleviate the strain on Treasury refinancing.
3. USstockmarket to continue bull run in 1H2025.
Wall Street analysts predict that the S&P 500 index will ascend steadily in 2025, reaching levels between 6500 and 7100, indicating a potential upside of 8% to 18%. This forecast is underpinned by the growth in corporate earnings, the narrative surrounding artificial intelligence (AI), and the unyielding calls for rate cuts. The momentum behind these predictions has strengthened, buoyed by the impact of Trump’s tax reductions, the promotion of AI technologies (US$ 500B Stargate project), and the deregulatory initiatives spanning various sectors like energy and finance.
4. HKresidential property prices to drop 5% more in 2025.
Despite the lifting of the Special
Stamp Duty (SSD), Buyer’s Stamp Duty (BSD), and Non-Resident Stamp Duty (NRSD), alongside a relaxation of the mortgage cap ratio to 70% and 100 bp rate cuts in the U.S. in 2024, the Hong Kong property market experienced a decline exceeding 6% in 2024. This downturn was attributed to aggressive price reductions by developers in response to an oversupply of properties. According to Midland Property, the primary property inventory in Hong Kong at the close of 2024 totaled 21,764 units, or approximately 38,000 units when including newly approved sales. At the average monthly sales rate of 1,409 primary units in 2024, it would require 27 months to fully absorb this inventory. Thus, we project that developers will persist in their price reductions throughout 2025 to expedite the clearance of excess stock, leading to an additional decline of over 5% in residential property prices.
5. Depreciation of RMB to 7.6 USD/RMB and 1:1 HKD/RMB.
In defiance of the 100 basis point rate cuts by the United States in the latter half of 2024, RMB encountered a 4.1% devaluation against USD (sliding from 7 to 7.3) and 3.6% devaluation against HKD (sliding from 1.11 to 1.06) during Q4 2024. This descent was precipitated by the imposition of US Section 301 tariffs ranging from 25% to 100% on electric vehicles (EVs), solar cells, semiconductors, steel, aluminum, and medical equipment in September 2024. With Trump vowing to initiate further tariff rounds, possibly commencing at 10% and progressively escalating to 60% on all or parts of Chinese merchandise, we posit that the Chinese government will resort to devaluation as a countermeasure against the tariff repercussions. Considering the potential ramifications of capital outflows from the Chinese market should the RMB depreciate excessively, we project a more measured USD/RMB depreciation of 3.9% to 7.6 USD/RMB and HKD/RMB depreciation of 5.7% to 1:1 HKD/RMB by 2025.
Disclaimer
All information used in the publication of this report has been compiled from publicly available sources that are believed to be reliable, however we do not guarantee the accuracy or completeness of this report and have not sought for this information to be independently verified. Forward-looking information or statements in this report contain information that is based on assumptions, forecasts of future results, estimates of amounts not yet determinable, and therefore involve known and unknown risks, uncertainties and other factors which may cause the actual results to be materially different from current expectations.
We shall not be liable for any direct, indirect or consequential losses, loss of profits, damages, costs or expenses incurred or suffered by you arising out or in connection with the access to, use of or reliance on any information contained on this note.