
Era of Globalization Officially Over
- HowTrump Tariffs will affect the Global Economy (Part 2)
Austin Or, CFA
Executive summary
U.S. President Donald Trump has unleashed an aggressive tariff escalation of 145% against China and 10% to 50% for other nations to reduce the U.S.’s $1.2 trillion trade deficit. The world economy and capital markets have entered a tumultuous period when the trade war is flaring.
Highlights
![]() The Trump 2.0 tariffs have escalated in 2025, driving global trade tensions through retaliatory measures, aligning with our January 17 Part 1 report forecast.
The Trump 2.0 tariffs have escalated in 2025, driving global trade tensions through retaliatory measures, aligning with our January 17 Part 1 report forecast.
![]() We accurately predicted the market movement since 17th January that Trump 2.0 tariff will crash the bond and stock markets, reflected by selloffs in bonds (GOVT down 1% YTD) and stocks (S&P 500 down 12.8% YTD).
We accurately predicted the market movement since 17th January that Trump 2.0 tariff will crash the bond and stock markets, reflected by selloffs in bonds (GOVT down 1% YTD) and stocks (S&P 500 down 12.8% YTD).
![]() From Jan 17th till March, Crypto held up, but entered into bear run since the signaling of imposition of sweeping tariffs in mid-March.
From Jan 17th till March, Crypto held up, but entered into bear run since the signaling of imposition of sweeping tariffs in mid-March.
![]() If Tariffs policy changes, the market will see a reversal upwards. If maintained, then a downward trajectory will follow.
If Tariffs policy changes, the market will see a reversal upwards. If maintained, then a downward trajectory will follow.
![]() During the 90-day tariff pause, we expect the market outlook to change to choppy with increased volatility as ally negotiations would advance, but risk-aversion for China-related tensions and policy uncertainty could trigger pullbacks.
During the 90-day tariff pause, we expect the market outlook to change to choppy with increased volatility as ally negotiations would advance, but risk-aversion for China-related tensions and policy uncertainty could trigger pullbacks.
![]() Short USD, long EUR and JPY are recommended to harness the Trump trade opportunities.
Short USD, long EUR and JPY are recommended to harness the Trump trade opportunities.
Trump’s Tariffs Upend Globalization with Formidable Global Trade Barriers
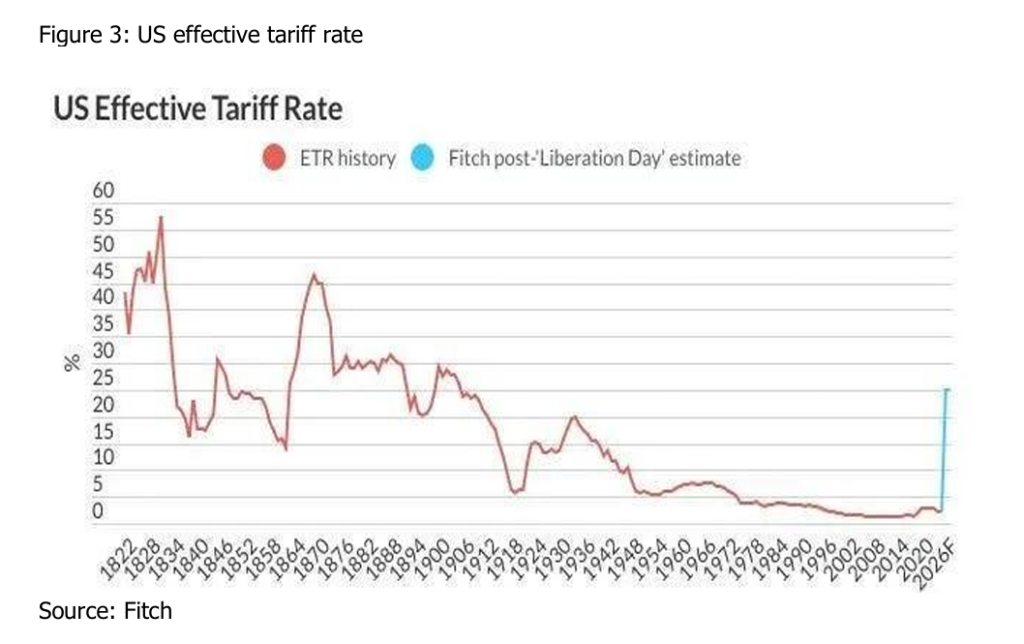
Since January 2025, President Donald Trump has rolled out an aggressive tariff escalation aimed at shrinking the U.S.’s $1.2 trillion trade deficit from 2024. The measures target global trading partners to boost American manufacturing and rebalance trade. Fitch Ratings predicts these policies will push the average effective U.S. import tariff from 2.5% in 2024 to 25% in 2025.
In February, the administration imposed an immediate 10% tariff on all Chinese imports. By March, this intensified: Chinese tariffs rose to 20%, most Canadian imports faced 25% duties (eased to 10% for energy and critical minerals), Mexican goods took a flat 25% hit, and steel and aluminum tariffs expanded to a uniform 25% worldwide. Other sector-specific tariffs were added: 25% on foreign automobiles and auto parts (partially eased for USMCA partners), 25% on imports from countries buying Venezuelan oil or gas, and 10% on Canadian energy and potash. Additional duties on semiconductors, lumber, copper, pharmaceuticals, and agricultural goods are pending.
On April 5, a universal 10% tariff hit imports from over 180 countries, with exemptions for goods already under specific duties—steel, aluminum, automobiles, auto parts, copper, pharmaceuticals, semiconductors, lumber, energy, and critical minerals—plus bullion and select energy products. Nations like the UK, Singapore, Brazil, Australia, New Zealand, Turkey, Colombia, Argentina, El Salvador, the UAE, and Saudi Arabia face only this baseline rate. USMCA-compliant exports from Canada and Mexico dodge both the 10% universal tariff and higher reciprocal duties, while non-compliant goods incur a 25% levy.
Set for April 9, “reciprocal” tariffs—ranging from 11% to 50%—target 57 countries with significant trade imbalances or non-reciprocal practices. Examples include China at 145% (34% plus a 91% retaliatory penalty, stacking with the 20% base), the EU at 20% (30% effective),
Japan at 24% (42% total), South Korea at 25% (35% effective), Vietnam at 46% (60% total), Taiwan at 32%, India at 26% (36% effective), Indonesia at 32% (42% total), Thailand at 36% (46% effective), and Cambodia at 49% (59% total). Dramatically, at the last moment, Trump announced a 90-day tariff delay for over 75 trading partners, capping their rates at 10% during this period, effective immediately, provided they refrain from retaliation and pursue negotiations.
On April 11, 2025, the Trump administration announced that smartphones, computers, and certain other electronic devices would be temporarily exempt from “reciprocal” tariffs, including the 145% levies on Chinese imports. However, on April 13, it clarified that this exemption was short-term, with plans for a “special focus” tariff on these electronics within one to two months, alongside sectoral tariffs targeting semiconductors and pharmaceuticals.

Retaliation and Responses from Trading Partners
Several U.S. trade counterparts have signaled or enacted reprisals, risking a descent into global trade warfare:
Canada and Mexico: Canada retaliated with 25% tariffs on $20 billion of U.S. goods (e.g., automobiles, steel, aluminum), effective shortly after U.S. measures. Mexico, adopting a more conciliatory stance, nonetheless grapples with 25% tariffs on autos and other exports, severely straining its economy.
China: In its own tit-for-tat tariffs, China imposed levies of 125% on US goods, supplementing prior levies of 15% on U.S. coal and liquefied natural gas, 10% on crude oil, agricultural machinery, and large-displacement vehicles. Chinese officials said that if the U.S. continues to impose tariffs on Chinese goods imported to the U.S., China will not top up retaliatory tariff further but will fight to the end if the U.S. goes too far, and called on Trump to “completely cancel” his so-called reciprocal tariffs.
European Union: The European Commission threatened €35 billion in retaliatory tariffs on U.S. goods like tech and agriculture, and decided that €21 billion American products will be subjected to tariffs of up to 25% in response to the U.S. tariffs on steel and aluminum. The tariffs will be implemented in three phases, taking effect in mid-April, mid-May, and on December 1, targeting products such as soybeans, diamonds, agricultural products, poultry, and motorcycles. Later, it announced to put trade retaliation measures on hold for 90 days to match US reciprocal tariff pause.
Other Nations: Japan, South Korea, and India are deferring retaliation, pursuing concessions. Vietnam has advocated for tariff elimination on U.S. imports and a 45-day postponement of the 46% U.S. tariff effective April 9.
Trump’s Tariffs Sideswiping the Markets
We accurately predicted the market movement since 17th January that Trump 2.0 tariff will crash the bond and stock markets.
Since tariff aggression in March and April, the capital market was whiplashed, triggering selloffs in U.S. bonds and stocks fulfilling the prophecies of our January 17 Part 1 report. Entering April 2025, U.S. tariffs have significantly impacted financial markets, creating volatility and uncertainty across asset classes, provoked by the broad 10% tariffs on imports and the 125% tariffs on Chinese goods, with a temporary 90-day pause announced on April 9.
U.S. Stock Market
Tariffs raised fears of inflation and reduced corporate earnings, prompting sell-offs. The pause alleviated some pressure, particularly for sectors like technology (e.g., Apple surged on tariff exemptions), but concerns about retaliatory measures from trading partners like Canada, Mexico, and China kept markets on edge.
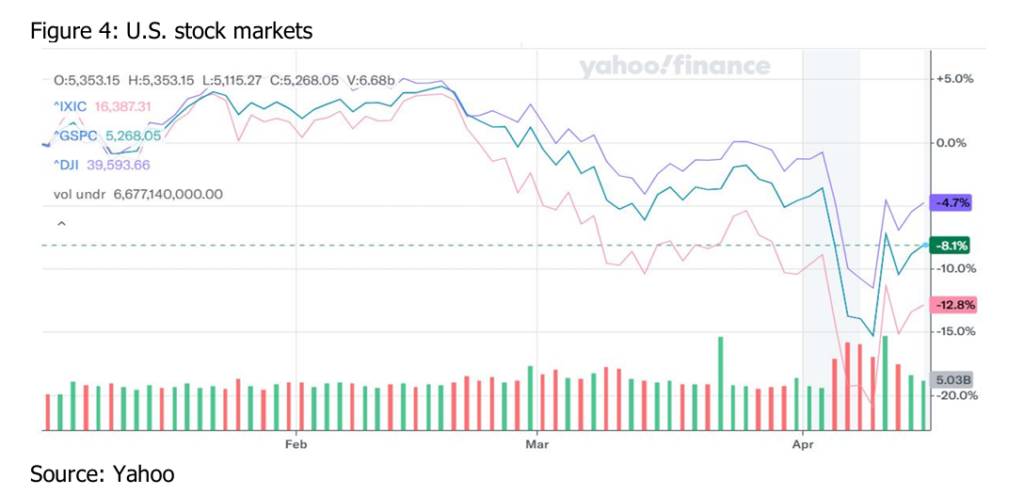
The U.S. stock market experienced extreme volatility following the tariff announcements. The S&P 500 dropped 6% in the week ending April 4, marking its worst week since 2020, with a peak loss of approximately $4-5 trillion across major indices (S&P 500, Dow, Nasdaq). After the tariff pause on April 9, stocks rebounded sharply, with the S&P 500 gaining 5.7%, the Dow 4.95%, and the Nasdaq 7.29% for the week ending April 11—the best weekly performance for some indices since 2023. However, by April 14, major averages remained down 4-4.7% from April 2 levels due to lingering uncertainty.
Year to date, S&P 500, Nasdaq and Dow declined-12.8%, 8.1% and 4.7% respectively.
U.S. Bond Market
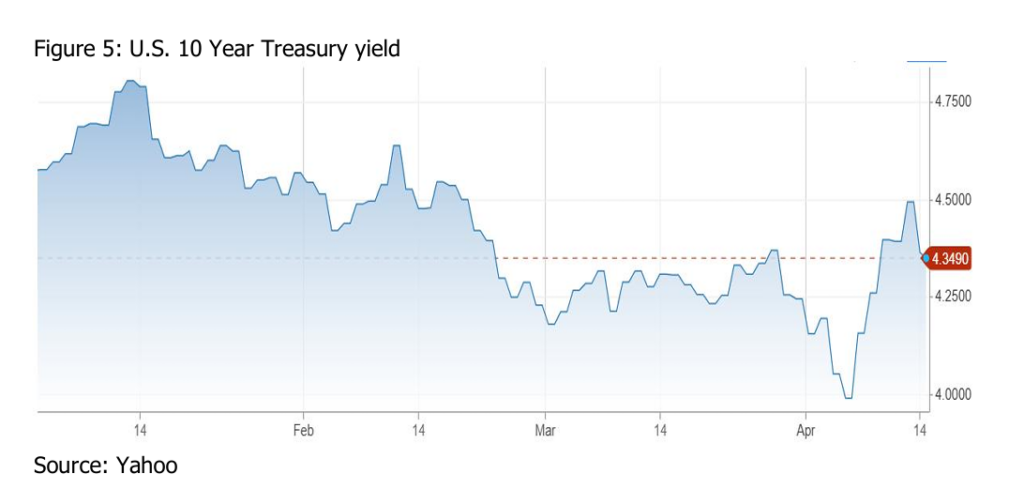
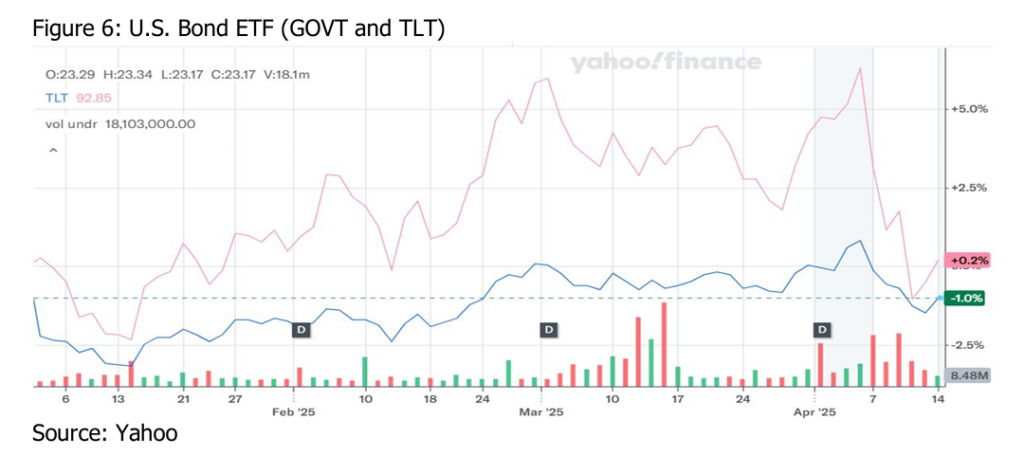
Tariffs disrupted the bond market’s safe-haven status, as investors feared higher inflation and borrowing costs. Hedge funds unwound leveraged trades, widening bid-ask spreads and straining liquidity, reminiscent of the 2020 “dash-for-cash.” The tariff pause eased yields slightly, but concerns about foreign investors (e.g., Japan, China) reducing Treasury holdings persisted, potentially weakening long-term demand. Rising yields increased borrowing costs, affecting mortgages (30-year rates hit 6.85%) and corporate loans.
Treasury yields surged, with the 10-year note climbing from below 3.9% to 4.31% by April 9, peaking at 4.51% overnight, and the 30-year bond hitting 5.02%, levels not seen since 2023. The iShares 20+ Year Treasury Bond ETF (TLT) fell over 4% in the week of April 7-11, indicating a sharp sell-off in bond prices.
Year to date, S&P 500, GOVT was down 1% while TLT edged up 0.2% respectively.
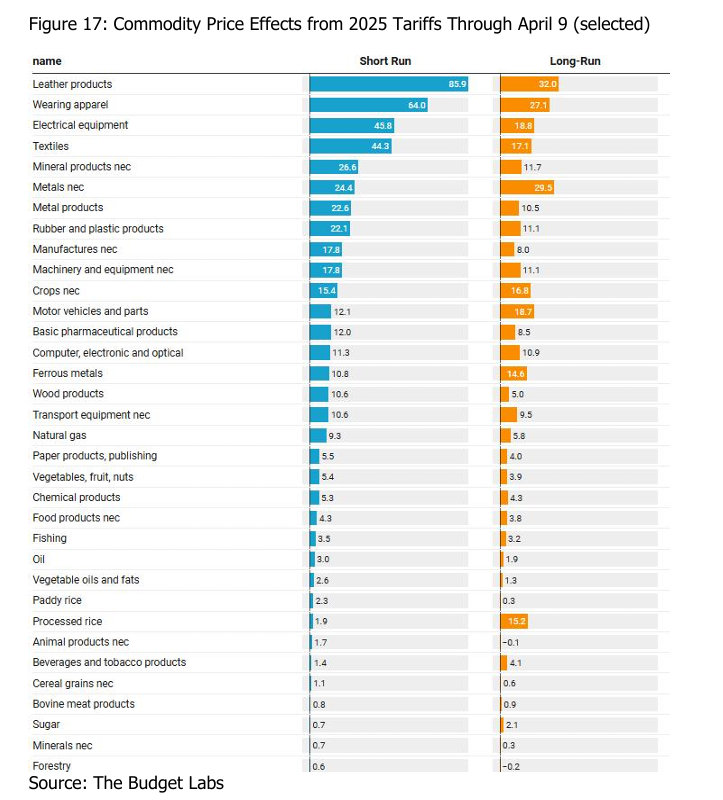
Commodities
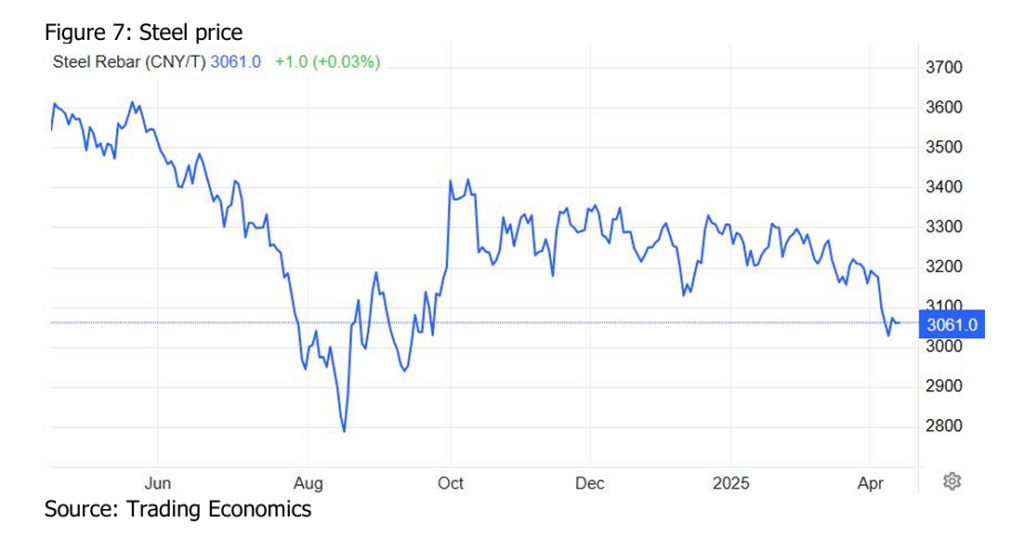
The 25% U.S. tariffs on steel and aluminum imports (effective March 12, continued into April) and 10% global tariffs increased costs for U.S. consumers, disrupting global supply chains. China’s retaliatory 34% tariffs on U.S. goods and fears of reduced demand due to higher prices pressured steel prices downward. The pause eased some panic, but uncertainty about long term trade flows kept prices soft. China’s 125% retaliation on U.S. goods and Canada’s planned 25% surtax on Chinese aluminum (set for May 2025) disrupted trade flows, pressuring prices. The tariff pause reduced fears of immediate escalation, supporting a partial recovery.
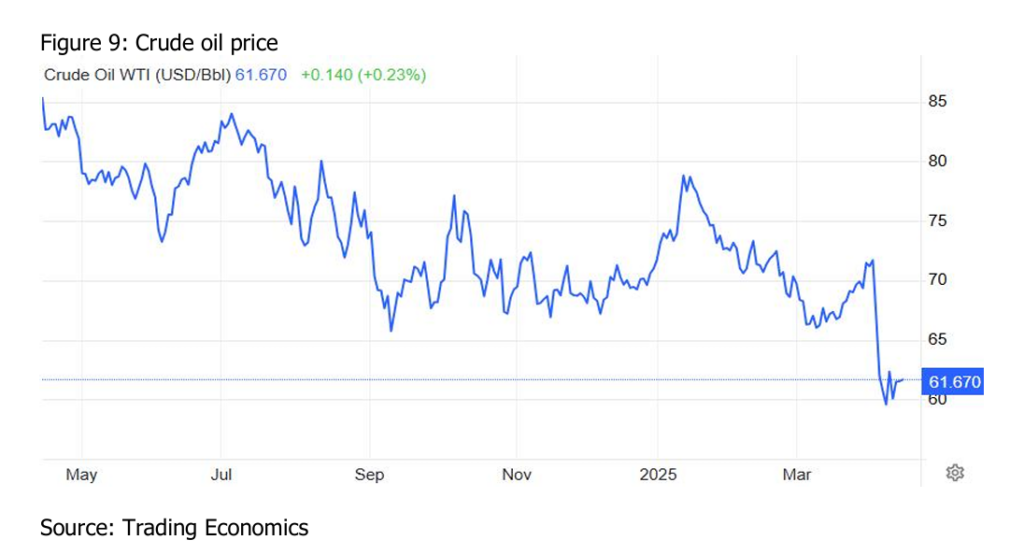
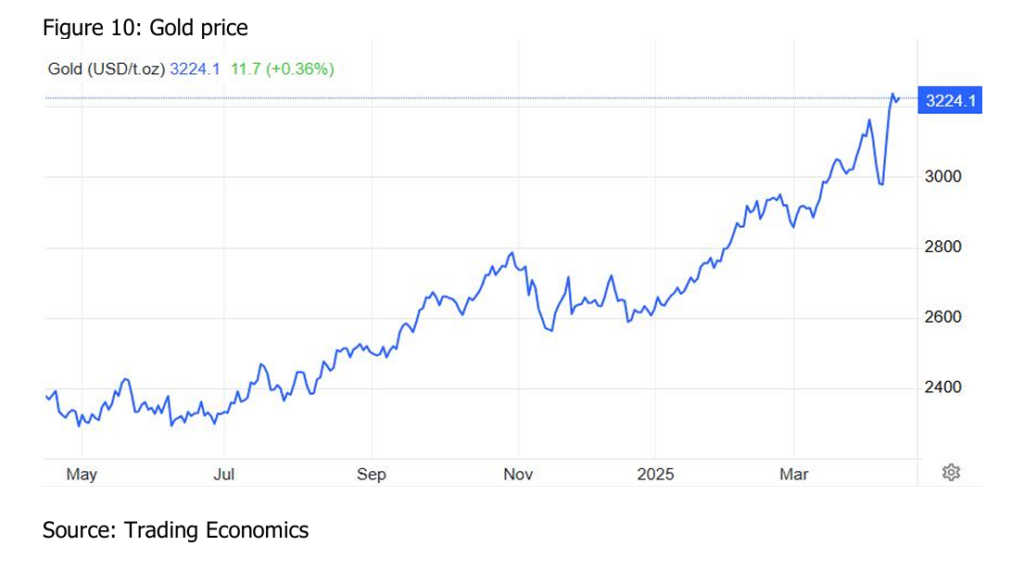
Tariffs reduced global demand expectations for oil, exacerbating supply glut concerns as OPEC+ planned to ramp up production in May. Gold benefited from uncertainty and a weakening dollar, while industrial metals like steel faced price pressures from tariffs on raw materials (e.g., 25% on steel imports). Strong safe-haven demand amid tariff threats and economic uncertainty boosted silver early in 2025. However, April’s tariffs raised concerns about industrial demand (50% of silver use), particularly in energy transition sectors, slowing gains.
Commodities showed mixed responses. Oil prices fell sharply, with U.S. crude down 14% and Brent down 13% since April 2, closing at $61.52 and $64.88 per barrel, respectively, by April 14. OPEC cut its demand growth forecast by 150,000 barrels per day due to tariff-related economic slowdown fears. Gold, however, hit a record high above $3,082.90, up 3.4% in the week of April 9, as investors sought safe havens. Iron ore rose 2.8% to $99.40.
Year to date, crude oil wiped out 13.63%, steel decreased 7.52%, aluminum prices fell 6.48%, while gold and silver gained 18.57% and 11.7% respectively.


Currencies
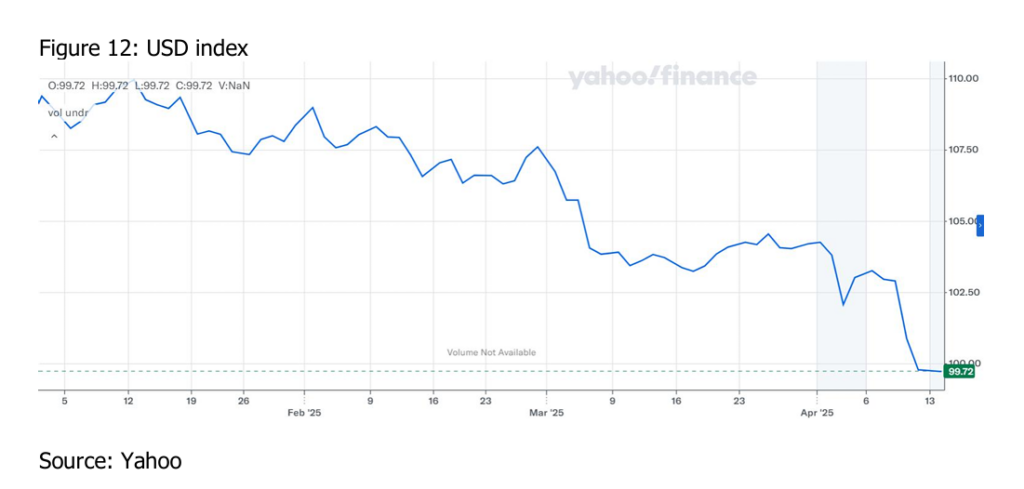
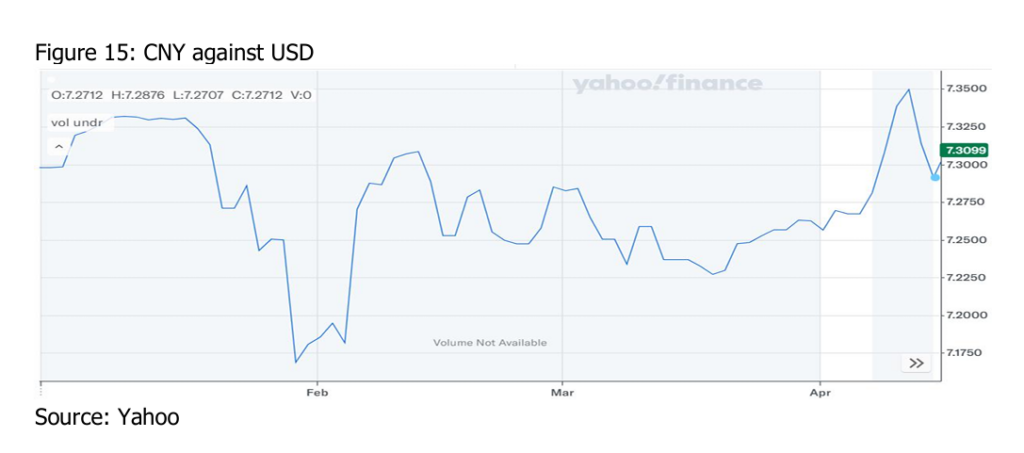
Investors viewed tariffs as a self-inflicted economic wound, reducing confidence in U.S. growth and prompting a sell-off in dollar-denominated assets. Retaliatory measures from trading partners and speculation about foreign bond dumping (e.g., by China) further pressured the dollar. A potential yuan devaluation loomed as China countered 125% U.S. tariffs, while the yen and euro benefit from safe-haven flows and dollar wobbles.
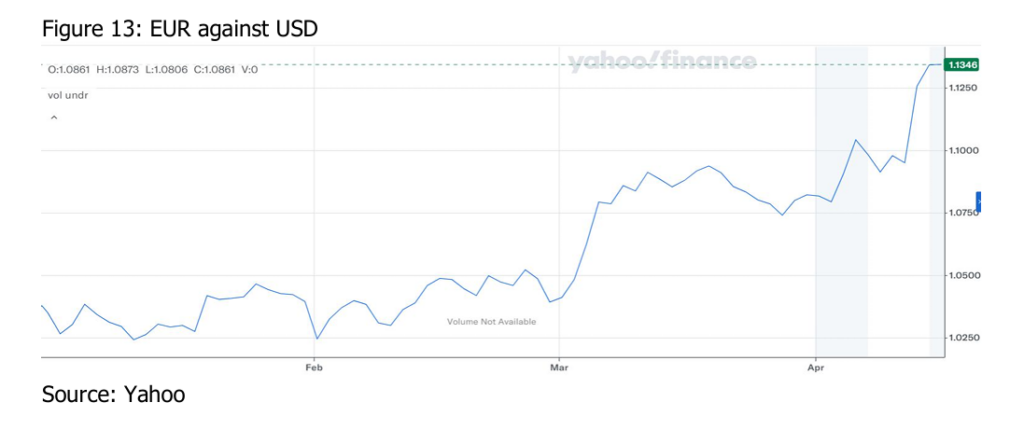
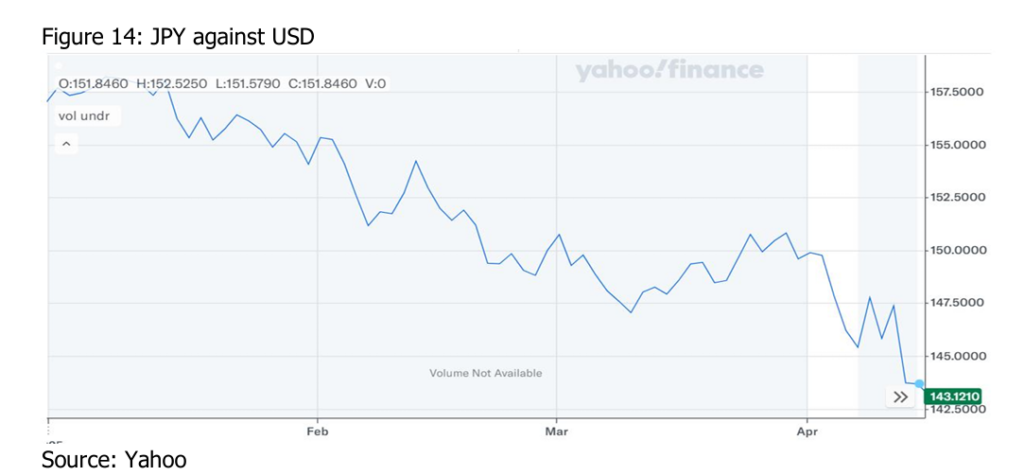
The U.S. dollar weakened unexpectedly, with the dollar index dropping from 104.2 on April 2 to 103.2 by April 9, despite tariffs typically boosting the dollar. The euro strengthened modestly, up ~0.5–0.8% in April, with EUR/USD reaching ~1.0958 by mid-April. The yen gained ~1-1.5% in April, with USD/JPY dropping to ~143 by April 15 from ~147 early in the month. The yuan weakened sharply, down ~2–3% in April, with USD/CNY hitting 7.3069 onshore and the offshore yuan falling to a record low of 7.4287. Tariffs slashed China’s export outlook ($200 billion loss estimated), prompting a managed depreciation to cushion the blow.
Year to date, US dollar index dived 1.24%, yuan down roughly 3-4%, euro is up around 0.5-1% YTD while yen has gained about 1-2%.
Cryptocurrencies
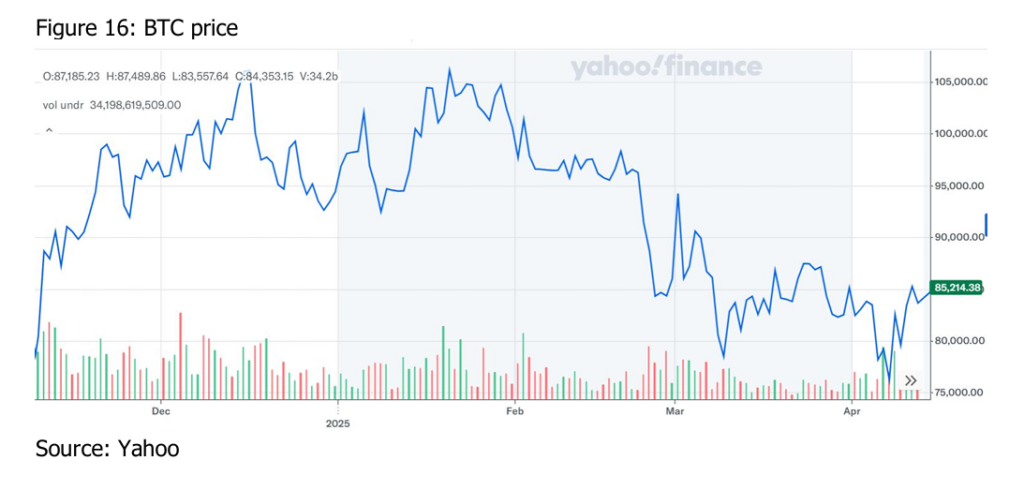
From Jan 17th till March, Crypto held up, but entered into bear run since the signaling of imposition of sweeping tariffs in mid-March.Tariffs increased economic uncertainty, driving investors away from volatile assets like crypto toward safer options like gold. Higher costs for imported mining equipment threatened profitability, while inflation fears raised the prospect of tighter monetary policy, diverting capital from digital assets.
Cryptocurrencies faced significant declines. Bitcoin dropped 10% since April 2, falling below $78,000 by April 6 after peaking at $110,000 in January. Crypto investment funds saw $795 million in outflows in the week prior to April 14, nearly erasing 2025 inflows.
Year to date, Bitcoin tanked 14.12%.
Economic Impact of Tariff
The U.S.
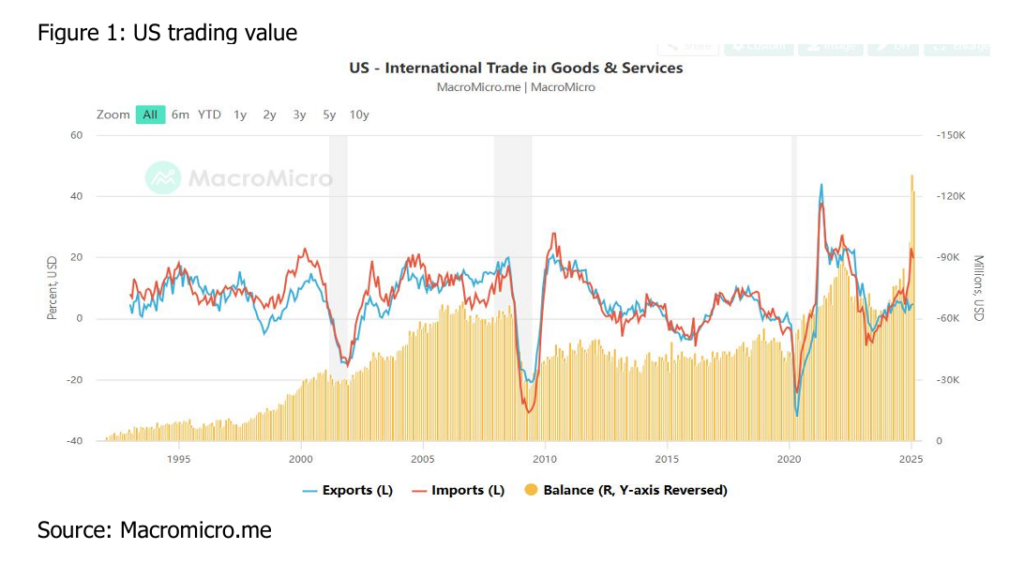
With a 2024 trade deficit of $1.2 trillion, tariffs seek to curb imports, boost exports, counter non-reciprocal practices (e.g., subsidies, dumping, foreign VATs, market entry restriction), and incentivize domestic output.The U.S. imported $3.3 trillion in goods in 2024; a 10% baseline tariff/18% add-on weighted-average tariff could yield ~$330 billion/$594 billion annually. Yet, elevated import costs will inflate production expenses, curtail domestic consumption, and erode corporate tax revenue. Retaliation will diminish export earnings, while exemptions, subsidies to beleaguered sectors (e.g., agriculture), and tax incentives will further erode gains. The Budget Lab estimates the the 2025 tariffs to date, were they to remain in place (and not expire after 90 days), would raise $2.4 trillion over 2026-35, with-$587 billion in negative dynamic revenue effects of tax revenue reduction due to economic contraction and reduced export.
Pre-tariff projections pegged 2025 GDP growth at 2.1%. The April 2 tariffs, constricting consumption and exports, are forecast to throttle real GDP growth to 0.1%–1.7% (Goldman Sachs, Citibank, UBS, Budget Labs), with JP Morgan warning of a-0.6% recessionary plunge. Recession probabilities for 2025 have surged to 60% (JP Morgan) and 45% (Goldman Sachs) for the U.S. and globe, respectively.
Tariffs inflate import costs, with the April 2 measures projected to elevate core inflation by 0.7%–1.7% to 3.5%–4.4% (Wall Street estimates) or by 2.9% pre-substitution)/1.3% post substitution per the Budget Labs- equivalent of a loss of purchasing power of $4,700 pre substitution/$2,700 post-substitution per household on average in 2024 dollars .
The Budget Labs estimated that tariffs implemented through April 7 would raise the unemployment rate by 0.5 percentage points by Q4 2025, reaching 4.7% from 4.2%, while JPMorgan predicted a “self-inflicted recession” with unemployment rising to 5.2% in 2025, compared to the Federal Reserve’s 4.4% baseline, driven by tariffs and inflation pressures.
Retaliation and market volatility amplify growth fears, outweighing inflation concerns. This pressures the Fed to ease—mirroring 2019’s three rate cuts (75 basis points total) during trade tensions. Markets expect 2-4 cuts in 2025, ranging from 50 to 100 basis points, with the first likely in June, as the Fed prioritizes staving off a slowdown over inflation risks.
China
China’s unrivaled industrial ecosystem—spanning consumer goods (apparel, electronics) and raw materials (rare earths, lithium, defense materials, API), —defies substitution due to constraints in capacity, resources, and logistics elsewhere. Before tariffs, Chinese goods are often 30–70% cheaper than U.S. equivalents due to lower labor costs, subsidies, and scale. With a 145% tariff on Chinese goods in 2025, many imported products from China could still remain cheaper than their U.S.-made counterparts such as toys textile, electronics accessories and furniture.
China’s been “decoupling” from the U.S., boosting trade with The EU (16% of exports, $573 billion) , ASEAN (15%, $510 billion) and the Global South (e.g., Belt and Road nations took 47% of exports in 2024). Its export has grown 35% to US$ 3.58 trillion since 2018 despite U.S.
tariffs.
Yet, China’s ability to offset U.S. tariffs by increasing trade elsewhere faces steep hurdles. The U.S. market, absorbing $439 billion in Chinese goods yearly, is unmatched—neither the EU, slowed by its own issues, nor other blocs can fill the gap. Global supply chains amplify this: tariffs disrupt exports to third countries like Southeast Asia, which rely on Chinese inputs for U.S.-bound goods. Competitor nations—India, Vietnam, Mexico—are also diversifying away from China, wary of trade deficits or U.S. pressure. A weaker yuan (down 3-4% YTD to ~7.3069) aids exports but hikes import costs, squeezing manufacturers. Redirecting trade demands costly investments in logistics and compliance, with no quick payoff. China’s domestic woes—real estate slumps, high debt, weak demand—curb its ability to subsidize new trade routes. Fiscal stimulus focuses on stability, not expansion.
Post-2018 tariffs (25% on $250 billion of Chinese goods) cut U.S. imports from China by 18% in two years. With 145%, the drop could be steeper—estimates suggest a 30-50% reduction in import volume by late 2025 (down from $439 billion in 2024), shrinking Chinese imports to $200-300 billion annually, dropping the U.S. share to 10-12% of China’s export market by 2026 ($400 billion or less of a projected $3.5 trillion total). The U.S. market’s reduced weight pressures China’s economy—exports drive 20% of its GDP. A 1-2% GDP drop is possible if U.S. demand craters, though domestic stimulus and new markets could offset this over time.
Global
Eurozone: Growth forecasts are slashed to 0.6–0.8%, with a 0.4–0.7% GDP hit from U.S. tariffs on EU exports, worsened by weaker trade and confidence.
Canada and Mexico: Canada faces a-2.2% long-term GDP hit, while Mexico could enter a deep recession (-1.3% in 2025). Both are highly exposed to U.S. demand.
Southeast Asia: Countries like Vietnam and Thailand see modest downgrades (0.1–0.4% off GDP) due to weaker Chinese and U.S. demand. Trade diversion could help some.
Other EMs: Brazil, India, and Argentina are less exposed to the U.S. export, with stable or slightly lower forecasts (India at 6.8%, Argentina up to 3.5%). Hungary and Malaysia face cuts (0.4–0.6%) tied to global trade slowdowns.
Path Forward
Within 90 days (April-July 2025)
During the 90-day tariff pause, we expect the market outlook to change to choppy with increased volatility as ally negotiations would advance, but risk-aversion for China-related tensions and policy uncertainty could trigger pullbacks.
After 90 days (July 2025 Onward)
If Tariffs policy changes, the market will see a reversal upwards. If maintained, then a downward trajectory will follow.
We expect there are over 60% chance that Trump to compromise post-delay, lowering reciprocal tariffs with the 75 nations and opening talks with China and the EU on account of:
1. Trump’s aggressive tariffs—potentially reigniting inflation, tipping the U.S. into recession, and provoking retaliation from China, the world’s manufacturing powerhouse—have sparked backlash from U.S. consumers, businesses, Wall Street, and even some MAGA supporters.
2. The Fed is likely to lower rate in June, reducing Treasury interest rate to allure reshoring of manufacturing companies as Trump wishes.
3. The U.S. export reliant countries are expected to accept Trump’s terms such as opening market, reduce import tariff, forming trade alliance and purchase U.S. Treasuries as a trade-off for lower tariffs.
4. Given that the U.S. has $9 trillion Treasuries maturing in 2025 with $6 trillion in June, EU and China will insist not reaching a quick deal with the U.S. to lower the price tag for reciprocal tariff cut.
5. Based on first-term patterns, where tariff relief often came 6–12 months after escalation due to negotiations or economic strain, a downsize or significant adjustment in 2025 is likely within a similar timeframe. The 90-day pause (ending July 8, 2025) suggests an initial window for deals, as seen with the USMCA resolution. If negotiations with allies like Canada, Mexico, or the EU progress, exemptions or reductions could emerge by Q3 2025 (July–September). For China, the deeper escalation may delay relief, but first-term precedent (Phase One after ~18 months) points to possible stabilization by Q4 2025 (October–December) if markets worsen or global talks advance. Some analysts, like UBS, project tariffs dropping to 10–15% by Q3 2025 if allies negotiate effectively.
If Trump scales back the tariff in Q3—the S&P 500 could reclaim its February peak of 6,140 or higher, igniting rallies in commodities (e.g., oil, copper) and cryptocurrencies (e.g., Bitcoin, Ether).
Conversely, if reciprocal tariffs fully activate and China and the EU escalate the trade war, the S&P 500 risks a 15-25% plunge—akin to the 27% drop in the 1980-1982 recession or the 34% dive in 2020’s COVID-19 crash. This would drag Treasuries (yields rising as prices fall), commodities, and crypto into bear territory, with oil potentially below $60 and Bitcoin under $70,000.
Investor Strategy
Short USD, long EUR and JPY are recommended to harness the Trump trade opportunities.
Short USD
U.S. tariffs disrupt trade and spark stagflation and recession apprehension. Amid a persistent trade deficit and $36 trillion national debt, the USD could depreciate over time to ease the debt burden and boost exports. The rate cut (2-4 times in 2025) and QE odds ($5-6 trillion per UBS) are also supportive of USD devaluation going forward.
Long EUR
As distrust in the Trump administration and its policies grows, the euro has partly assumed the U.S. dollar’s traditional safe-haven role. Expectations of increased German fiscal spending, following Germany’s historic relaxation of fiscal rules, bolster prospects for Eurozone resilience
amid a global economic slowdown. Meanwhile, U.S. tariffs on European goods, regardless of their final level, will likely reduce Europe’s trade surplus with the U.S., decreasing capital flows back into dollar assets. Leveraged traders and institutional investors have pushed euro long positions to a six-month high. Traders report that hedge funds are betting on EUR/USD rising to 1.20 within three to six months.
Long JPY
U.S. tariff measures in 2025 have heightened safe-haven demand, fueling optimism for the Japanese yen among hedge funds and asset managers. Leveraged funds’ bullishness on the yen reached its highest level since January 2021, while asset managers’ long yen positions hit
a peak not seen since 2006 in the week ending April 8.
The Bank of Japan (BOJ) raised its policy rate to 0.5% by January 2025, after ending negative rates (-0.1%) in March 2024, targeting a neutral rate (~1%) to support a recovering economy (2.2% GDP growth in Q4 2024). Governor Kazuo Ueda stressed gradual hikes to maintain growth while addressing inflation, projected at 2.4–2.5% for fiscal 2025 (down from 3% current).
Goldman Sachs views the yen as the premier safe-haven currency, especially amid rising global macro stress. With a bearish USD outlook and increasing risk aversion, Goldman predicts the yen will outperform cyclical currencies and the dollar, forecasting a swift decline in USD/JPY to 135.
Disclaimer
All information used in the publication of this report has been compiled from publicly available sources that are believed to be reliable, however we do not guarantee the accuracy or completeness of this report and have not sought for this information to be independently verified. Forward-looking information or statements in this report contain information that is based on assumptions, forecasts of future results, estimates of amounts not yet determinable, and therefore involve known and unknown risks, uncertainties and other factors which may cause the actual results to be materially different from current expectations.
We shall not be liable for any direct, indirect or consequential losses, loss of profits, damages, costs or expenses incurred or suffered by you arising out or in connection with the access to, use of or reliance on any information contained on this note.